
Illumos: Getting Started with MDB
This is a short introduction to MDB for the Illumos kernel. Everything we do here is easier and more straight forward to do with DTrace, but that is normal for such a simple example. We cover how to attach the debugger to a running kernel, set breakpoints and step through the kernel side of an ioctl() call.
To begin with, we will set up serial console for use in VirtualBox on a Windows host, and connect to it with Putty. You can skip this part if you already have console access to your Illumos box.
Table of Contents
Configuring the Serial Console
Preparing for Debugging with MDB
Stepping Through the Kernel Code
Configuring the Serial Console
While I hardly ever use Windows myself, I had the opportunity to do these experiments on a Windows host and the directions reflect that. Big kudos to Pinchii for a quick introduction, and the Haiku team for covering this too.
We start by configuring VirtualBox to connect the COM1 serial port to a named pipe.
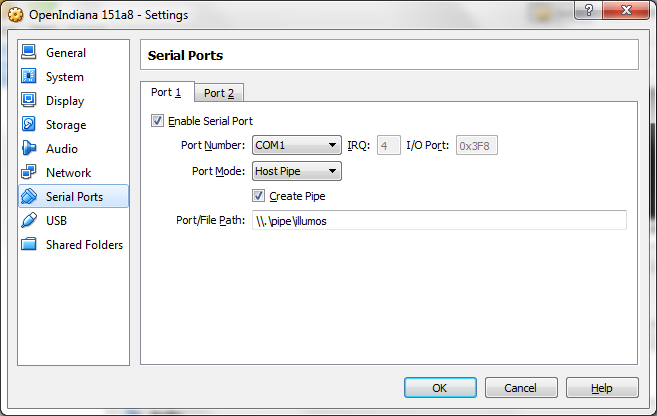
The port mode is host pipe, the create pipe box is checked, and the port/file path is \\.\pipe\illumos. This means the pipe is created on the localhost (the dot) with the name illumos. Pipe names can be 256 characters, can include any (special) character but backslash and are not case sensitive according to the MSDN; they must follow this pattern.
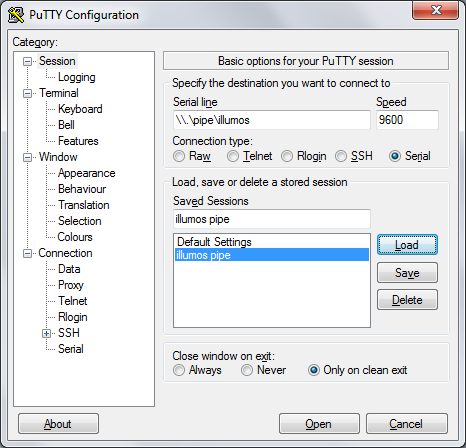
In Putty, we select serial connection, with the serial line set to the named pipe from earlier; in this case \\.\pipe\illumos. Leave the speed at 9600 for now1. As soon as we boot the virtual machine, we can connect with the open button. Be careful not to let the grub timeout expire.
To direct the console to the serial line, we edit the kernel command line in the grub menu. Select the desired boot menu entry and press e to edit it.
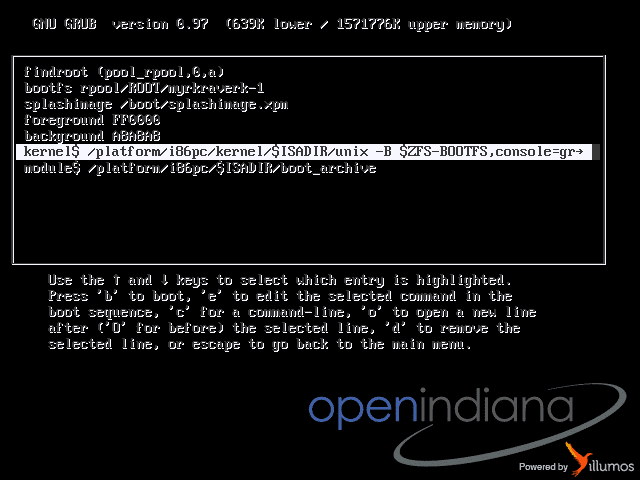
Then select the kernel line and press e again.
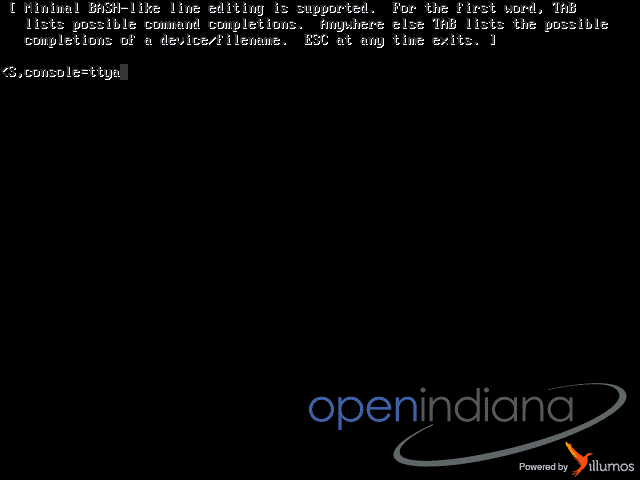
Change console=graphics at the end of the line to console=ttya and press return. Then use b to boot.
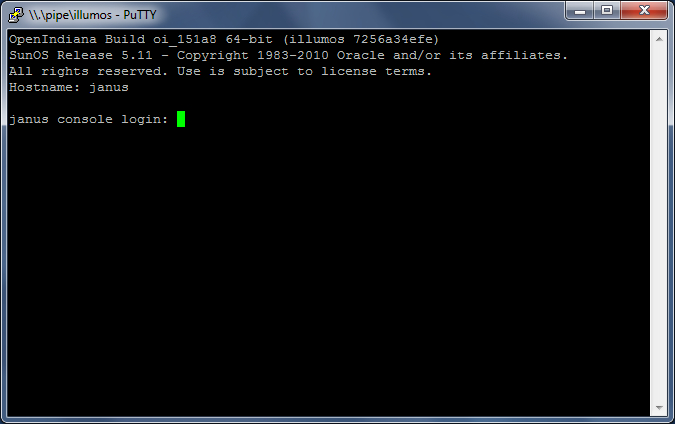
When the system is ready, our console session should look something like this.
Quick Directions for OS X
First if you don’t have it, install socat with Brew: $ brew install socat
Then configure VirtualBox exactly like above, except you need to name the pipe with a valid filename. Something in /tmp is a good choice, in this case: /tmp/illumos
Set the console to ttya in grub. Then the following one-liner from tonejito will do the trick with screen.
screen `socat -d -d /tmp/illumos PTY 2>&1 | tee /tmp/x &>/dev/null & grep '.*N\ PTY\ is\ ' /tmp/x | sed -e 's/.*N\ PTY\ is\ //g'`
Preparing for Debugging with MDB
We are going to step through some kernel code, in this case the ioctl() entry point of our own module, to watch the reference count, and the write count of a vnode as we call some file manipulation functions.
The following structure is the kernel’s internal representation of a file, a vnode. It is the v_count, v_rdcnt and v_wrcnt fields we are going to monitor.
typedef struct vnode {
	kmutex_t	v_lock;		/* protects vnode fields */
	uint_t		v_flag;		/* vnode flags (see below) */
	uint_t		v_count;	/* reference count */
	void		*v_data;	/* private data for fs */
	struct vfs	*v_vfsp;	/* ptr to containing VFS */
	struct stdata	*v_stream;	/* associated stream */
	enum vtype	v_type;		/* vnode type */
	dev_t		v_rdev;		/* device (VCHR, VBLK) */

	/* PRIVATE FIELDS BELOW - DO NOT USE */

	struct vfs	*v_vfsmountedhere; /* ptr to vfs mounted here */
	struct vnodeops	*v_op;		/* vnode operations */
	struct page	*v_pages;	/* vnode pages list */
	struct filock	*v_filocks;	/* ptr to filock list */
	struct shrlocklist *v_shrlocks;	/* ptr to shrlock list */
	krwlock_t	v_nbllock;	/* sync for NBMAND locks */
	kcondvar_t	v_cv;		/* synchronize locking */
	void		*v_locality;	/* hook for locality info */
	struct fem_head	*v_femhead;	/* fs monitoring */
	char		*v_path;	/* cached path */
	uint_t		v_rdcnt;	/* open for read count  (VREG only) */
	uint_t		v_wrcnt;	/* open for write count (VREG only) */
	u_longlong_t	v_mmap_read;	/* mmap read count */
	u_longlong_t	v_mmap_write;	/* mmap write count */
	void		*v_mpssdata;	/* info for large page mappings */
	void		*v_fopdata;	/* list of file ops event watches */
	kmutex_t	v_vsd_lock;	/* protects v_vsd field */
	struct vsd_node *v_vsd;		/* vnode specific data */
	struct vnode	*v_xattrdir;	/* unnamed extended attr dir (GFS) */
	uint_t		v_count_dnlc;	/* dnlc reference count */
} vnode_t;
Defined in usr/src/uts/common/sys/vnode.h.
The following is the function we are going to step through. The sequence of calls to vn_open(), vn_rdwr(), VOP_CLOSE() and VN_RELE() is based on examples found in the kernel sources.
static int
demo_ioctl( dev_t dev, int cmd, intptr_t arg, int mode,
    cred_t *cred_p, int *rval_p )
{

    if ( cmd == 0 )
    {
   	 vnode_t *vp;

   	 int r = vn_open( "/root/test",
   		 UIO_SYSSPACE,
   		 FWRITE | FCREAT,
   		 0,
   		 &vp,
   		 0,
   		 0 );

   	 if ( r != 0 )
   	 {
   		 cmn_err( CE_WARN, "Unable to vn_open(/root/test)" );

   		 return r;
   	 }

   	 char test[] = { 't', 'e', 's', 't', '\n' };

   	 ssize_t resid;

   	 r = vn_rdwr( UIO_WRITE,
   		 vp,
   		 (caddr_t) test,
   		 sizeof test,
   		 (offset_t) 0,
   		 UIO_SYSSPACE,
   		 0,
   		 (rlim64_t) sizeof test,
   		 CRED(),
   		 &resid );

   	 if ( r != 0 )
   	 {
   		 cmn_err( CE_WARN, "Unable to write to /root/test" );

   		 goto vop_close;
   	 }

   	 // Potentially use the file more...

vop_close:
   	 VOP_CLOSE( vp, FWRITE, 1, (offset_t) 0,
   		 CRED(), NULL );
   	 VN_RELE( vp );

   	 return r;
    }
    else
    {
   	 return EINVAL;
    }
We use -rS -fvebose-asm instead of -c for the the gcc command line to get the following assembly output.
	.type    demo_ioctl, @function
demo_ioctl:
.LFB13:
    pushq    %rbp    /
.LCFI3:
    movq    %rsp, %rbp    /,
.LCFI4:
    pushq    %rbx    /
.LCFI5:
    movl    $22, %ebx    /, r
    subq    $72, %rsp    /,
.LCFI6:
    testl    %esi, %esi    / cmd
    je    .L12    /,
    movl    %ebx, %eax    / r,
    addq    $72, %rsp    /,
    popq    %rbx    /
    leave
    ret
    .p2align 4,,10
    .p2align 3
.L12:
    leaq    -40(%rbp), %r8    /,
    xorl    %r9d, %r9d    /
    xorl    %ecx, %ecx    /
    movl    $0, (%rsp)    /,
    movl    $258, %edx    /,
    movb    $1, %sil    /,
    movq    $.LC0, %rdi    /,
    call    vn_open    /
    testl    %eax, %eax    / r
    movl    %eax, %ebx    /, r
    jne    .L13    /,
    movb    $116, -32(%rbp)    /, test
    movb    $101, -31(%rbp)    /, test
    movb    $115, -30(%rbp)    /, test
    movb    $116, -29(%rbp)    /, test
    movb    $10, -28(%rbp)    /, test
    call    threadp    /
    leaq    -48(%rbp), %rcx    /, tmp71
    leaq    -32(%rbp), %rdx    /, tmp69
    xorl    %r8d, %r8d    /
    movl    $1, %r9d    /,
    movl    $1, %edi    /,
    movq    %rcx, 24(%rsp)    / tmp71,
    movq    456(%rax), %rax    / .t_cred, .t_cred
    movl    $5, %ecx    /,
    movq    $5, 8(%rsp)    /,
    movl    $0, (%rsp)    /,
    movq    %rax, 16(%rsp)    / .t_cred,
    movq    -40(%rbp), %rsi    / vp,
    call    vn_rdwr    /
    testl    %eax, %eax    / r
    movl    %eax, %ebx    /, r
    jne    .L14    /,
.L10:
    call    threadp    /
    movq    -40(%rbp), %rdi    / vp,
    movq    456(%rax), %r8    / .t_cred,
    xorl    %r9d, %r9d    /
    xorl    %ecx, %ecx    /
    movl    $1, %edx    /,
    movl    $2, %esi    /,
    call    fop_close    /
    movq    -40(%rbp), %rdi    / vp,
    call    vn_rele    /
    movl    %ebx, %eax    / r,
    addq    $72, %rsp    /,
    popq    %rbx    /
    leave
    ret
    .p2align 4,,10
    .p2align 3
.L14:
    movq    $.LC2, %rsi    /,
    movl    $2, %edi    /,
    xorl    %eax, %eax    /
    call    cmn_err    /
    jmp    .L10    /
    .p2align 4,,10
    .p2align 3
.L13:
    xorl    %eax, %eax    /
    movq    $.LC1, %rsi    /,
    movl    $2, %edi    /,
    call    cmn_err    /
    movl    %ebx, %eax    / r,
    addq    $72, %rsp    /,
    popq    %rbx    /
    leave
    ret
.LFE13:
    .size    demo_ioctl, .-demo_ioctl
Armed with this, we know what the assembly output of our function looks like. We see from line 129 that vp is stored at -40(%rbp) which is what we want to inspect. On line 101, this address is loaded into register %r8 and we can simply grab it from there.
Introduction to MDB
MDB is the Modular Debugger. The -K parameter tells mdb to stop the running kernel.
The basic skeleton of an mdb command is address ::command arguments. Where the address is often omitted. The commands covered in this short tutorial are ::dis to disassemble, ::bp to set breakpoints, ::cont to continue execution, ::next to step over an instruction, ::regs to show register contents and ::print to display variables.
The ::print command takes as argument the type of data to display, in the examples below we print a pointer with vnode_t* and the vnode itself with vnode_t. For structures, ::print also accepts fields to display.
Stepping Through the Kernel Code
After loading the module, we enter the kernel debugger in the console with mdb -K. In our case, the module is called demo and we tell mdb to disassemble the function with ::dis.
[0]> demo`demo_ioctl::dis
demo`demo_ioctl:              pushq  %rbp
demo`demo_ioctl+1:            movq   %rsp,%rbp
demo`demo_ioctl+4:            pushq  %rbx
demo`demo_ioctl+5:            movl   $0x16,%ebx
demo`demo_ioctl+0xa:          subq   $0x48,%rsp
demo`demo_ioctl+0xe:          testl  %esi,%esi
demo`demo_ioctl+0x10:         je     +0xe     <demo`demo_ioctl+0x20>
demo`demo_ioctl+0x12:         movl   %ebx,%eax
demo`demo_ioctl+0x14:         addq   $0x48,%rsp
demo`demo_ioctl+0x18:         popq   %rbx
demo`demo_ioctl+0x19:         leave
demo`demo_ioctl+0x1a:         ret
demo`demo_ioctl+0x1b:         nopl   0x0(%rax,%rax)
demo`demo_ioctl+0x20:         leaq   -0x28(%rbp),%r8
demo`demo_ioctl+0x24:         xorl   %r9d,%r9d
demo`demo_ioctl+0x27:         xorl   %ecx,%ecx
demo`demo_ioctl+0x29:         movl   $0x0,(%rsp)
demo`demo_ioctl+0x30:         movl   $0x102,%edx
demo`demo_ioctl+0x35:         movb   $0x1,%sil
demo`demo_ioctl+0x38:         movq   $0xfffffffff8bf4ef0,%rdi
demo`demo_ioctl+0x3f:         call   +0x2f6f5b4       <vn_open>
demo`demo_ioctl+0x44:         testl  %eax,%eax
demo`demo_ioctl+0x46:         movl   %eax,%ebx
demo`demo_ioctl+0x48:         jne    +0xba    <demo`demo_ioctl+0x108>
demo`demo_ioctl+0x4e:         movb   $0x74,-0x20(%rbp)
demo`demo_ioctl+0x52:         movb   $0x65,-0x1f(%rbp)
demo`demo_ioctl+0x56:         movb   $0x73,-0x1e(%rbp)
demo`demo_ioctl+0x5a:         movb   $0x74,-0x1d(%rbp)
demo`demo_ioctl+0x5e:         movb   $0xa,-0x1c(%rbp)
demo`demo_ioctl+0x62:         call   +0x2c77f49       <threadp>
demo`demo_ioctl+0x67:         leaq   -0x30(%rbp),%rcx
demo`demo_ioctl+0x6b:         leaq   -0x20(%rbp),%rdx
demo`demo_ioctl+0x6f:         xorl   %r8d,%r8d
demo`demo_ioctl+0x72:         movl   $0x1,%r9d
demo`demo_ioctl+0x78:         movl   $0x1,%edi
demo`demo_ioctl+0x7d:         movq   %rcx,0x18(%rsp)
demo`demo_ioctl+0x82:         movq   0x1c8(%rax),%rax
demo`demo_ioctl+0x89:         movl   $0x5,%ecx
demo`demo_ioctl+0x8e:         movq   $0x5,0x8(%rsp)
demo`demo_ioctl+0x97:         movl   $0x0,(%rsp)
demo`demo_ioctl+0x9e:         movq   %rax,0x10(%rsp)
demo`demo_ioctl+0xa3:         movq   -0x28(%rbp),%rsi
demo`demo_ioctl+0xa7:         call   +0x2f6f07c       <vn_rdwr>
demo`demo_ioctl+0xac:         testl  %eax,%eax
demo`demo_ioctl+0xae:         movl   %eax,%ebx
demo`demo_ioctl+0xb0:         jne    +0x3e    <demo`demo_ioctl+0xf0>
demo`demo_ioctl+0xb2:         call   +0x2c77ef9       <threadp>
demo`demo_ioctl+0xb7:         movq   -0x28(%rbp),%rdi
demo`demo_ioctl+0xbb:         movq   0x1c8(%rax),%r8
demo`demo_ioctl+0xc2:         xorl   %r9d,%r9d
demo`demo_ioctl+0xc5:         xorl   %ecx,%ecx
demo`demo_ioctl+0xc7:         movl   $0x1,%edx
demo`demo_ioctl+0xcc:         movl   $0x2,%esi
demo`demo_ioctl+0xd1:         call   +0x2f72a52       <fop_close>
demo`demo_ioctl+0xd6:         movq   -0x28(%rbp),%rdi
demo`demo_ioctl+0xda:         call   +0x2f6f279       <vn_rele>
demo`demo_ioctl+0xdf:         movl   %ebx,%eax
demo`demo_ioctl+0xe1:         addq   $0x48,%rsp
demo`demo_ioctl+0xe5:         popq   %rbx
demo`demo_ioctl+0xe6:         leave
demo`demo_ioctl+0xe7:         ret
demo`demo_ioctl+0xe8:         nopl   0x0(%rax,%rax)
demo`demo_ioctl+0xf0:         movq   $0xfffffffff8bf4edd,%rsi
demo`demo_ioctl+0xf7:         movl   $0x2,%edi
demo`demo_ioctl+0xfc:         xorl   %eax,%eax
demo`demo_ioctl+0xfe:         call   +0x2ea5fb5       <cmn_err>
demo`demo_ioctl+0x103:        jmp    -0x53    <demo`demo_ioctl+0xb2>
demo`demo_ioctl+0x105:        nopl   (%rax)
demo`demo_ioctl+0x108:        xorl   %eax,%eax
demo`demo_ioctl+0x10a:        movq   $0xfffffffff8bf4efb,%rsi
demo`demo_ioctl+0x111:        movl   $0x2,%edi
demo`demo_ioctl+0x116:        call   +0x2ea5f9d       <cmn_err>
demo`demo_ioctl+0x11b:        movl   %ebx,%eax
demo`demo_ioctl+0x11d:        addq   $0x48,%rsp
demo`demo_ioctl+0x121:        popq   %rbx
demo`demo_ioctl+0x122:        leave
demo`demo_ioctl+0x123:        ret
Here, every immediate value is given in hexadecimal, so we have to be careful not to get confused when comparing to the annotated assembly from earlier. The instruction we are paying attention to is on line 15 so we can just break there with
[0]> demo`demo_ioctl+0x20::bp
And then re-start the kernel with
[0]> ::cont
root@janus:~#
Now, when we execute the ioctl, mdb will stop before that instruction in the console. Note that the GUI, if you have it in front of you, will freeze at this time.
root@janus:~# kmdb: stop at demo`demo_ioctl+0x20
kmdb: target stopped at:
demo`demo_ioctl+0x20: leaq   -0x28(%rbp),%r8
After executing ::next, we have the address of our pointer in register %r8. We can take a look with ::regs.
[0]> ::next
kmdb: target stopped at:
demo`demo_ioctl+0x24: xorl   %r9d,%r9d
[0]> ::regs
%rax = 0x0000000000000000                 %r9  = 0xffffff0003f96de4
%rbx = 0x0000000000000016                 %r10 = 0xffffffffc0014e80 demo`demo_cb_ops
%rcx = 0x0000000000100003                 %r11 = 0xffffff01061fb000
%rdx = 0x000000000d7acdc4                 %r12 = 0xffffff0003f96de4
%rsi = 0x0000000000000000                 %r13 = 0x000000000d7acdc4
%rdi = 0x0000012300000000                 %r14 = 0x0000000000000000
%r8  = 0xffffff0003f96c98                 %r15 = 0xffffff010e660e40

%rip = 0xfffffffff7ace944 demo`demo_ioctl+0x24
%rbp = 0xffffff0003f96cc0
%rsp = 0xffffff0003f96c70
%rflags = 0x00000246
  id=0 vip=0 vif=0 ac=0 vm=0 rf=0 nt=0 iopl=0x0
  status=<of,df,IF,tf,sf,ZF,af,PF,cf>

                        %cs = 0x0030    %ds = 0x004b    %es = 0x004b
%trapno = 0x1           %fs = 0x0000    %gs = 0x01c3
   %err = 0x0
[0]>
We can take a look at the value of this pointer with ::print. Note that in PuTTY, selecting will copy, and a right mouse button will paste.
[0]> 0xffffff0003ec2c98::print vnode_t*
strwrite+0x1f
Obviously, before the call to vn_open() the pointer contains garbage. After a few more ::nexts.
demo`demo_ioctl+0x3f: call   +0x2f6f5b4       <vn_open>
[0]> ::next
kmdb: target stopped at:
demo`demo_ioctl+0x44: testl  %eax,%eax
[0]> 0xffffff0003ec2c98::print vnode_t*
0xffffff0116906200
We now have a valid pointer to the vnode we want to monitor. If we take a look at the ::regs again, we see that this value is also in registers %rsi, %rdi and %r8; noting this makes future debugging easier because we can just grab the value from the registers after calling vn_open().
We take a look at the vnode itself with another ::print.
[0]> 0xffffff0116906200::print vnode_t
{
    v_lock = {
        _opaque = [ 0 ]
    }
    v_flag = 0x10000
    v_count = 0x2
    v_data = 0xffffff01181ae4f8
    v_vfsp = root
    v_stream = 0
    v_type = 1 (VREG)
    v_rdev = 0xffffffffffffffff
    v_vfsmountedhere = 0
    v_op = 0xffffff0107206980
    v_pages = 0
    v_filocks = 0
    v_shrlocks = 0
    v_nbllock = {
        _opaque = [ 0 ]
    }
    v_cv = {
        _opaque = 0
    }
    v_locality = 0
    v_femhead = 0
    v_path = 0xffffff01135d91f8 "/root/test"
    v_rdcnt = 0
    v_wrcnt = 0x1
    v_mmap_read = 0
    v_mmap_write = 0
    v_mpssdata = 0
    v_fopdata = 0
    v_vsd_lock = {
        _opaque = [ 0 ]
    }
    v_vsd = 0
    v_xattrdir = 0
    v_count_dnlc = 0x1
}
However, since we are only interested in v_count, v_rdcnt and v_wrcnt, we can include those fields on the ::print command, after the type.
[0]> 0xffffff0116906200::print vnode_t v_count v_rdcnt v_wrcnt
v_count = 0x2
v_rdcnt = 0
v_wrcnt = 0x1
At the moment, we can presume that the FCREAT flag is the cause of the v_wrcnt; further testing will confirm or deny that2.
Now we step past the vn_rdwr() call.
kmdb: target stopped at:
demo`demo_ioctl+0xa7: call   +0x2f6f07c       <vn_rdwr>
[0]> ::next
kmdb: target stopped at:
demo`demo_ioctl+0xac: testl  %eax,%eax
[0]> 0xffffff0116906200::print vnode_t v_count v_rdcnt v_wrcnt
v_count = 0x2
v_rdcnt = 0
v_wrcnt = 0x1
We note here that the vn_wrcnt hasn’t changed. Nor has v_count.
Now we step past fop_close() which is what the macro VOP_CLOSE() becomes. The next two examples are done by setting a breakpoint after each call.
kmdb: target stopped at:
demo`demo_ioctl+0xd6: movq   -0x28(%rbp),%rdi
[0]> 0xffffff0116906200::print vnode_t v_count v_rdcnt v_wrcnt
v_count = 0x2
v_rdcnt = 0
v_wrcnt = 0
Here, vn_wrcnt is reset and v_count is still 2.
Stepping past vn_rele,
kmdb: target stopped at:
demo`demo_ioctl+0xdf: movl   %ebx,%eax
[0]> 0xffffff01169062000::print vnode_t v_count v_rdcnt v_wrcnt
v_count = 0x1
v_rdcnt = 0
v_wrcnt = 0
we see that the v_count is set to 1.
Conclusion
Further research3 is needed to determine if this is the proper way to open and close files in the kernel. With only this information, we can’t tell if file creation should have two VN_RELE()s — unlikely, but we should figure out what holds another reference to the file.
Related Links
1To change the speed, we need to configure the Illumos kernel too, something we don’t cover here.
2Or just code inspection at src.illumos.org.
3Code inspection at src.illumos.org and experiments.